Building a Real-Time Bike Share Monitoring System: A Deep Dive into GBFS Data
The Problem That Started It All
Picture this: you’re rushing to catch a train, and you need to grab a bike from the nearest bike-sharing station. You open the app, and… the station shows bikes available, but when you get there, it’s empty. Sound familiar? This disconnect between real-time data and actual availability got me thinking about the infrastructure behind these systems.
That’s when I discovered GBFS (General Bikeshare Feed Specification), an open standard that bike-sharing providers use to publish real-time data about their systems. I realized there was an opportunity to build something that could monitor multiple bike-sharing systems simultaneously, giving us insights into availability patterns, system health, and usage trends across different cities.
What I Built
I created a comprehensive monitoring stack that collects real-time data from multiple GBFS providers and visualizes it through interactive dashboards. The system tracks everything from bike availability and dock status to station health across different cities like Buenos Aires, Mexico City, and Linz.
The stack consists of three main components:
- A custom Python exporter that fetches data from GBFS APIs
- Prometheus for metrics collection and storage
- Grafana for visualization and dashboards
But here’s the kicker, I didn’t just build it to run on my laptop. I designed the entire system with production-grade infrastructure in mind, using Terraform for AWS provisioning, Ansible for deployment automation, and GitHub Actions for CI/CD.
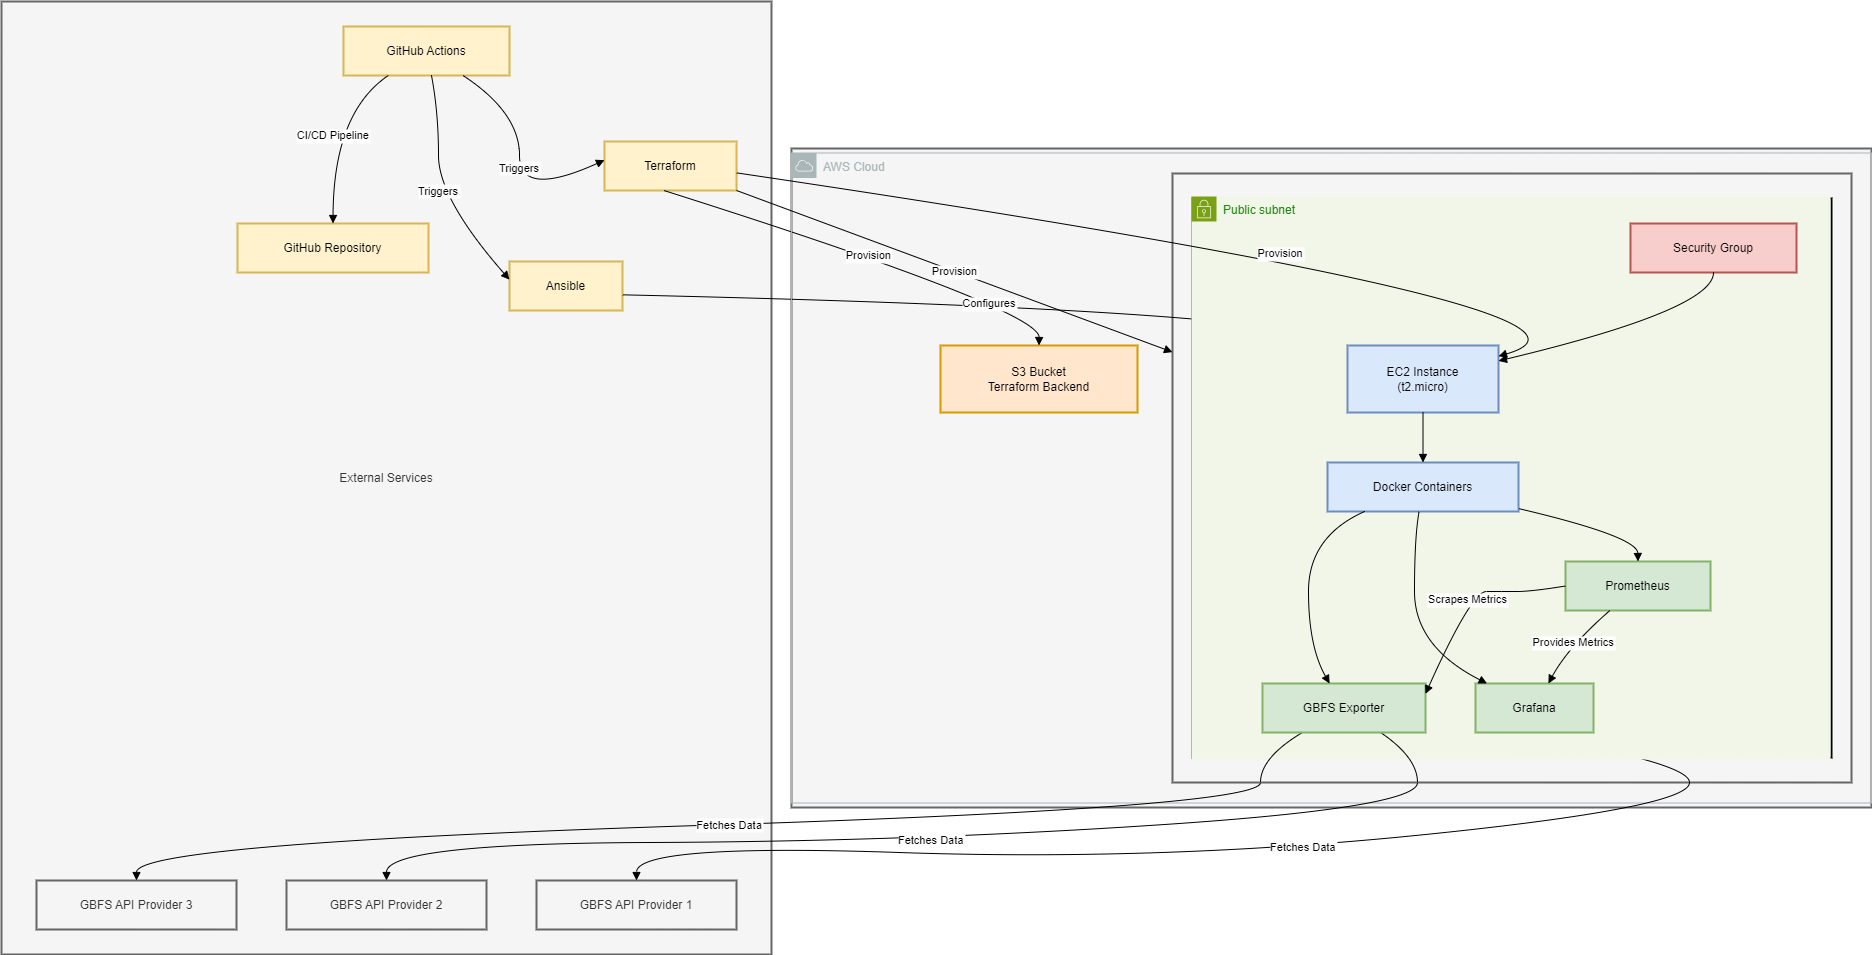 High-level architecture showing how all the components work together
Why This Approach?
You might be wondering why I went with such a robust setup for what could have been a simple data collection script. The answer lies in scalability and real-world applicability.
In my current role, I work extensively with Prometheus and Grafana for monitoring production systems. I’ve built multiple Prometheus exporters before (including one for Logstash that’s publicly available), so I knew this stack could handle the job beautifully.
More importantly, I wanted to demonstrate how you’d actually approach this problem in a professional environment. Sure, I could have written a quick script to pull some data, but that wouldn’t show the thought process behind building maintainable, scalable infrastructure.
The Technical Deep Dive
The Custom GBFS Exporter
The heart of the system is a Python application that speaks fluent GBFS. Here’s what makes it interesting:
Auto-discovery Magic: Instead of hardcoding API endpoints, the exporter uses GBFS auto-discovery URLs. You just point it to a provider’s discovery endpoint, and it figures out where to find station information, real-time status, and other feeds.
Multi-provider Support: The system can monitor multiple bike-sharing providers simultaneously. Currently, it’s tracking systems in Buenos Aires, Mexico City (Ecobici), and Linz, but adding new providers is as simple as updating a YAML configuration file.
Robust Error Handling: Real-world APIs are messy. Stations go offline, feeds become temporarily unavailable, and data formats sometimes vary. The exporter gracefully handles these situations without crashing or losing data from other providers.
Prometheus-Native Metrics: The exporter exposes metrics in Prometheus format, including both aggregate data (total bikes available across a city) and granular station-level information (bikes available at each individual station).
Here’s a glimpse of the metrics it generates:
gbfs_bikes_available_total{provider="Buenos Aires"} 1000
gbfs_docks_available_total{provider="Buenos Aires"} 500
gbfs_bikes_available{provider="Buenos Aires",station_id="3",station_name="003 - ADUANA"} 28.0
gbfs_station_is_renting{provider="Buenos Aires",station_id="3",station_name="003 - ADUANA"} 1.0
The Infrastructure Story
This is where things get interesting from a DevOps perspective. I could have just run everything locally, but I wanted to showcase how you’d deploy this in the real world.
Terraform for Infrastructure: I used Terraform to provision AWS infrastructure an EC2 instance, VPC, security groups, and all the networking bits. The state is stored in S3 for team collaboration (because nobody wants to deal with state file conflicts).
Ansible for Configuration Management: Once the infrastructure exists, Ansible takes over to install Docker, configure the monitoring stack, and deploy all the services. This separation of concerns makes the system much more maintainable.
GitHub Actions for CI/CD: The entire pipeline is automated. When I push changes to the exporter code, GitHub Actions builds a new Docker image, runs tests, and can automatically deploy to AWS. There’s even a manual approval step for infrastructure changes because nobody wants accidental AWS bills.
The Monitoring Stack
Prometheus handles all the heavy lifting for metrics collection. It scrapes the exporter every 15 seconds, storing time-series data that we can query and alert on. The configuration is straightforward but powerful:
1scrape_configs:
2  - job_name: 'gbfs-exporter'
3    static_configs:
4      - targets: ['exporter:8000']
5    scrape_interval: 15s
Grafana transforms raw metrics into actionable insights. I built dashboards that show:
- Real-time bike availability across all monitored cities
- Station status and health indicators
- Historical trends and usage patterns
- System-wide statistics and comparisons between providers
The Results
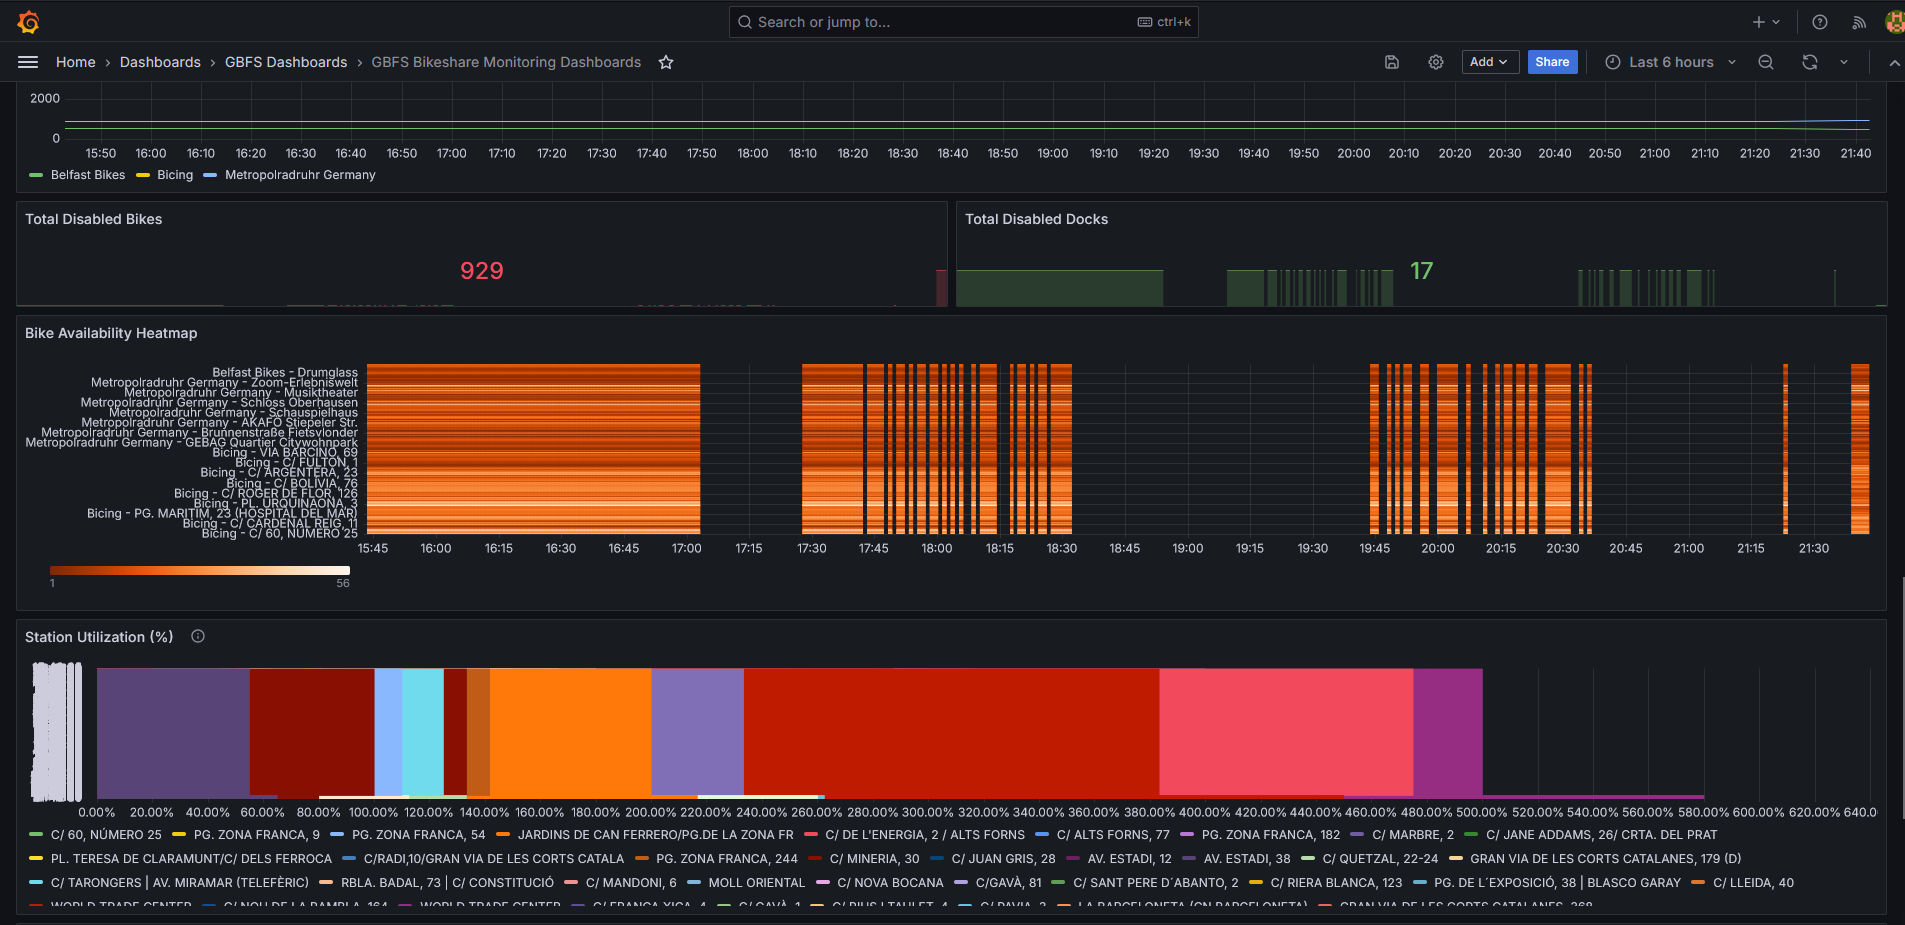
The dashboards reveal fascinating patterns. You can see morning and evening rush hour impacts on bike availability, identify stations that consistently run empty or full, and spot system-wide issues before they become major problems.
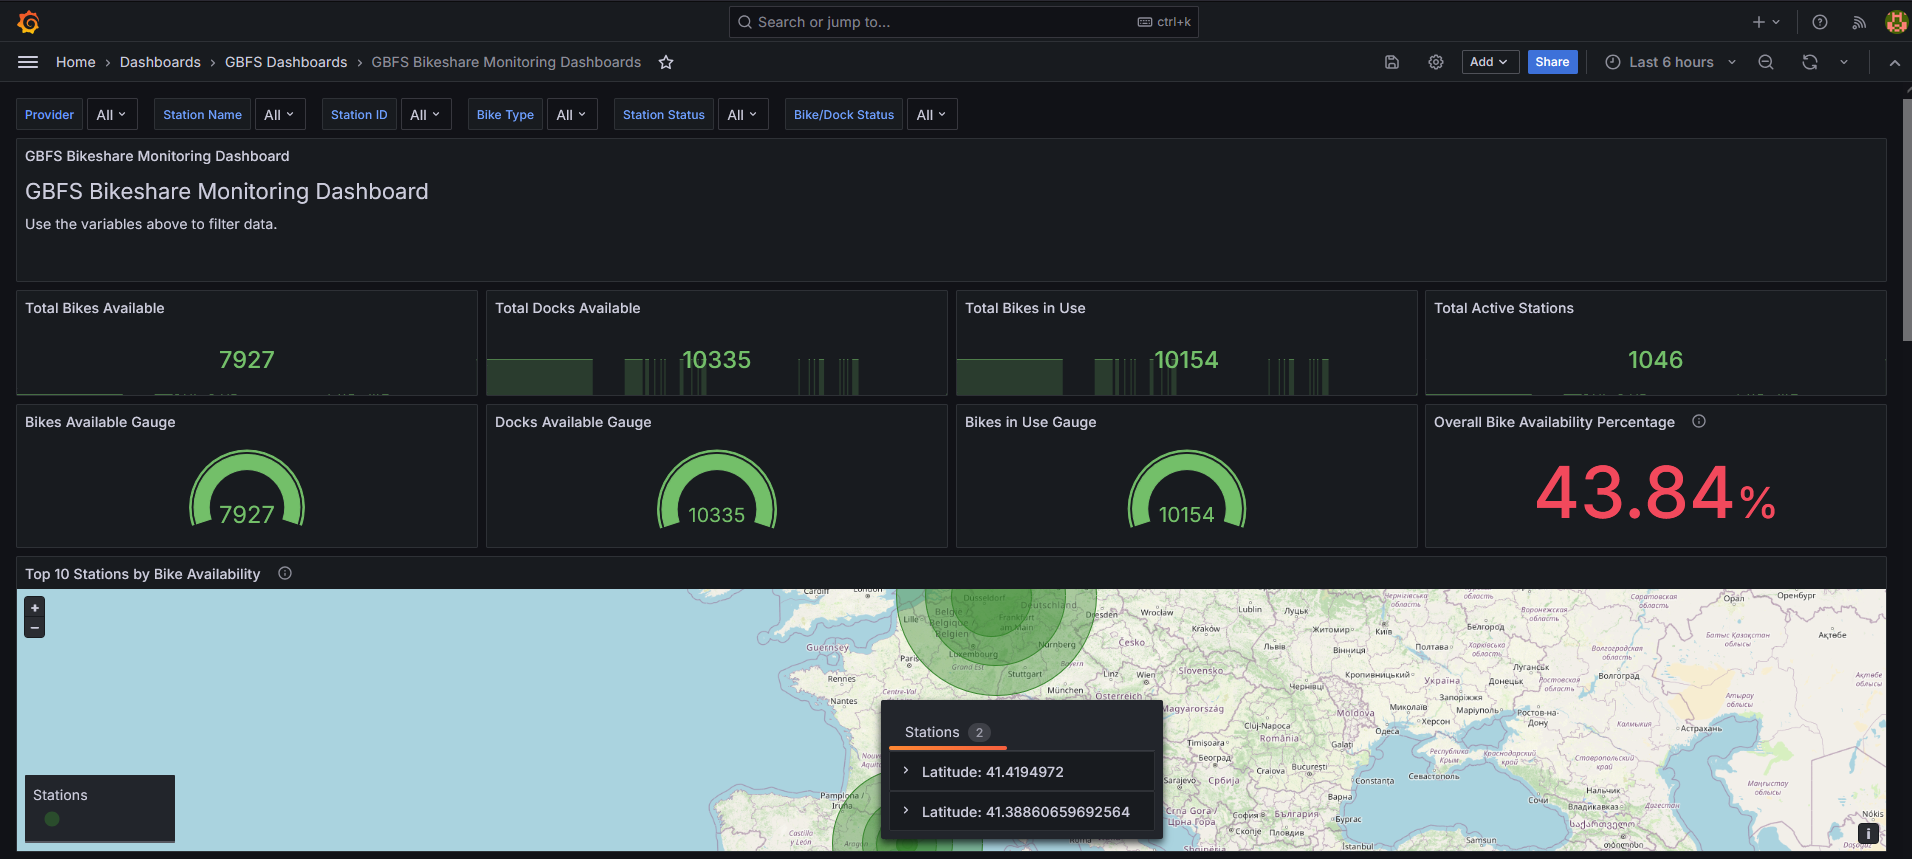
The main dashboard showing real-time bike availability across multiple cities
For example, the Buenos Aires system shows clear commuter patterns with bikes flowing from residential areas to business districts in the morning and reversing in the evening. The Linz system, being smaller, shows different usage patterns that reflect the city’s layout and population density.
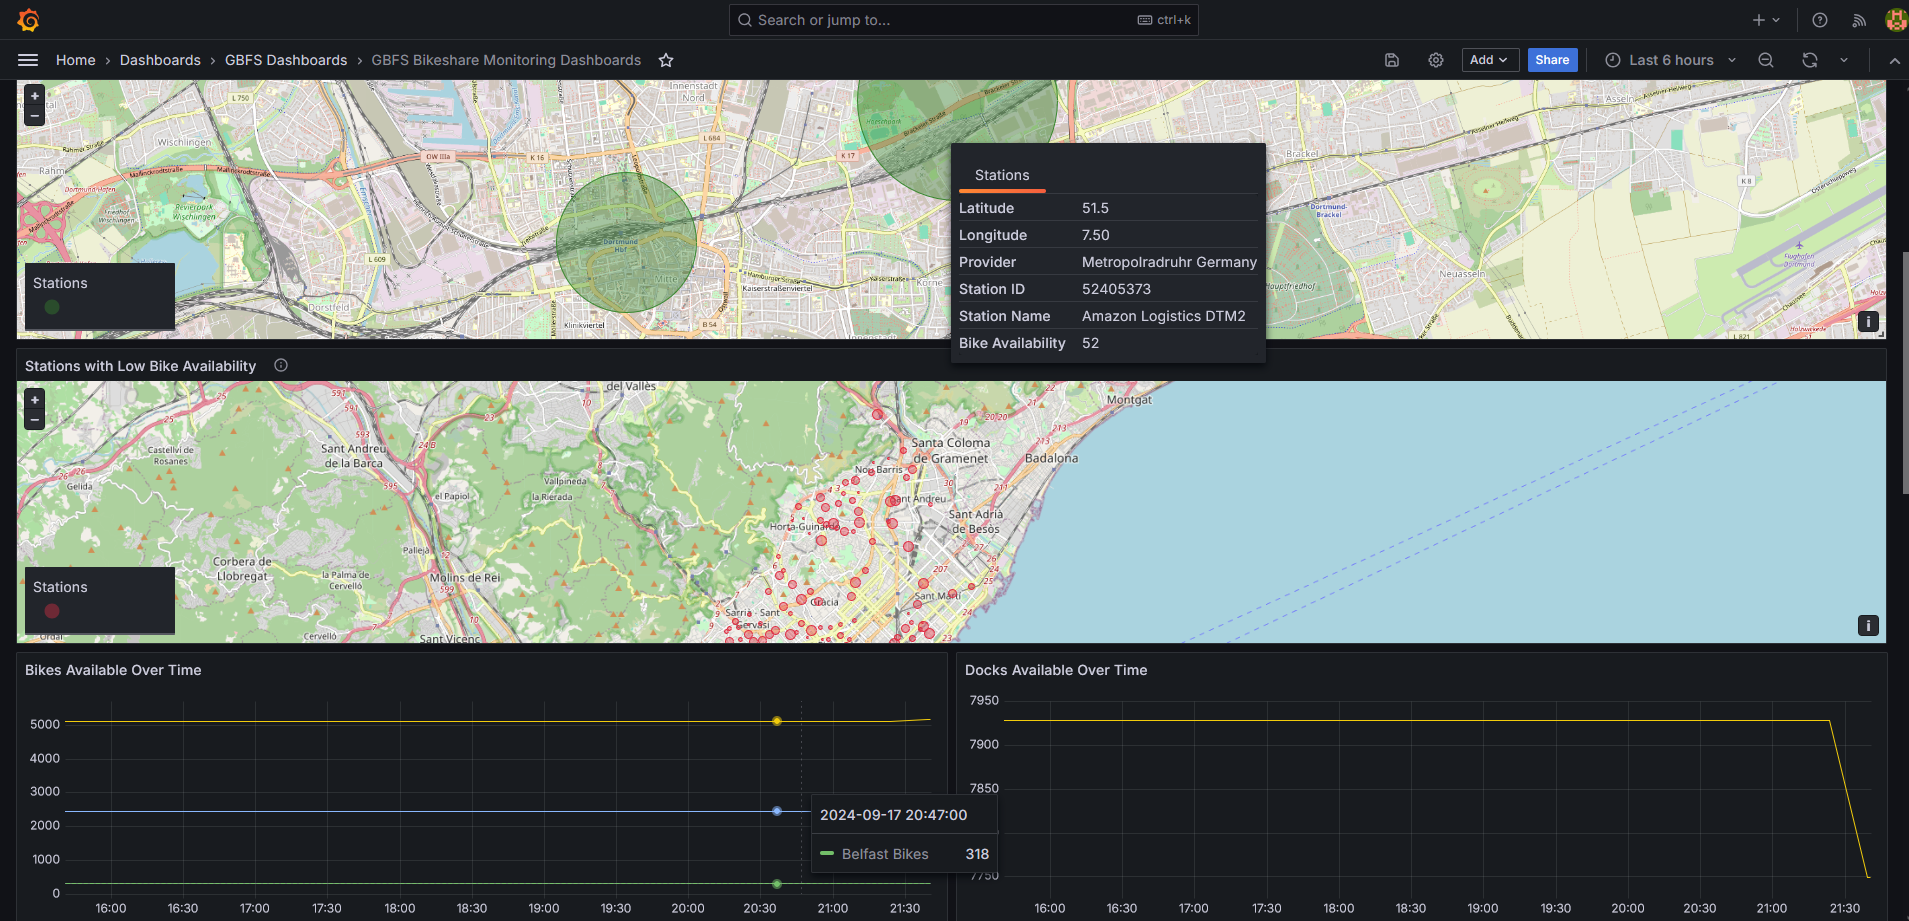 Detailed station-level metrics showing individual station performance and status
The time-series visualizations make it easy to spot trends and anomalies. You can see when stations consistently fill up or empty out, identify maintenance windows, and even spot seasonal patterns in usage.
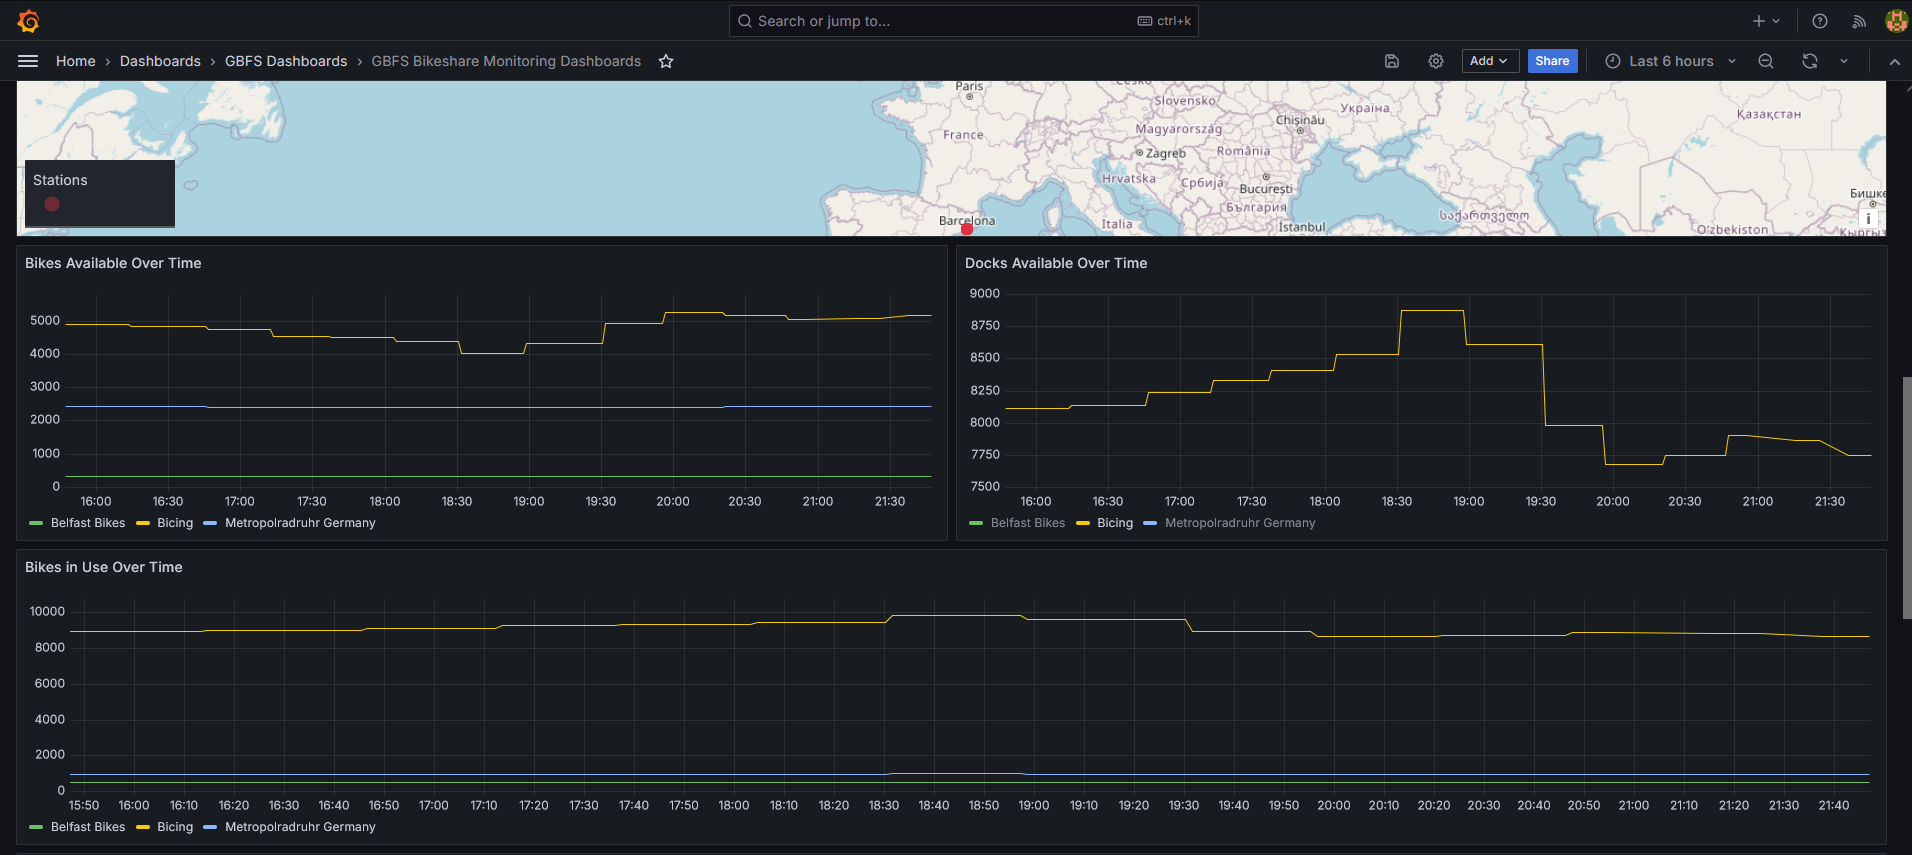 System-wide health metrics and provider comparisons
 Historical data showing usage patterns and system performance over time
Running It Yourself
I designed the system to be easy to deploy in multiple ways:
Local Development: Clone the repo, run docker compose up, and you’ve got the entire stack running locally in minutes. Perfect for testing or development.
AWS Deployment: For a production-like setup, the Terraform and Ansible configurations will provision and deploy everything to AWS. The GitHub Actions pipeline can handle this automatically.
Adding New Providers: Want to monitor your city’s bike-sharing system? Just add the GBFS auto-discovery URL to the providers.yaml file, and the system will start collecting data automatically.
Lessons Learned
Building this project reinforced several important principles:
Start with Standards: GBFS being an open standard made this project possible. Without standardized APIs, monitoring multiple providers would have been a nightmare of custom integrations.
Design for Operations: The monitoring and alerting capabilities aren’t just nice-to-have features, they’re essential for running any system in production. Being able to see when a provider’s API goes down or when data quality degrades is crucial.
Infrastructure as Code: Using Terraform and Ansible means the entire system is reproducible. Anyone can spin up an identical environment, and changes are version-controlled and reviewable.
Observability First: By building comprehensive metrics from the start, the system can tell you not just what’s happening, but why it’s happening and what might happen next.
What’s Next?
This project opens up several interesting possibilities:
Predictive Analytics: With historical data, we could build models to predict bike availability at specific stations and times.
Multi-City Comparisons: The standardized metrics make it easy to compare system performance across different cities and providers.
Alert Systems: Prometheus’s alerting capabilities could notify operators when stations are consistently empty or full, or when system-wide availability drops below thresholds.
API Integration: The metrics could feed back into bike-sharing apps to provide more accurate real-time information to users.
The Bigger Picture
While this started as a technical exercise in monitoring bike-sharing systems, it demonstrates broader principles that apply to any data integration and monitoring challenge. The combination of custom exporters, time-series databases, and visualization tools creates a powerful foundation for understanding complex systems.
Whether you’re monitoring bike shares, IoT sensors, or business metrics, the patterns are similar: collect standardized data, store it efficiently, and present it in ways that drive action.
The code is available on GitHub if you want to dive deeper or adapt it for your own use case. I’d love to see what other interesting data sources people connect to this kind of monitoring infrastructure.